Since future high energy colliders are designed for very frequent collisions, the response time of the amplifiers must be fast enough to distinguish particles coming from different bunch crossings. For charge-sensitive amplifiers this implies that the peaking time should be in the order of the bunch crossing period, which is challenging in terms of noise performance. An alternative solution has been developed which works with a larger peaking time. The principal target of the deconvolution method [32,33] is to restore the original detector current pulse by processing the shaper output signal with a special digital filter.
The shaper output is sampled with the bunch crossing clock frequency and stored in a
pipeline. Three consecutive values are added with individual weights to numerically compensate
the shaping process. With the sampled shaper output values ![]() and the weights
and the weights ![]() , the
deconvoluted output
, the
deconvoluted output ![]() becomes
becomes
| (2.33) |
 |
(2.34) | ||
 |
|||
 |
The APV chip (see section ![[*]](crossref.gif) , p.
, p. ![[*]](crossref.gif) ) of the CMS Silicon Strip Tracker has a peaking time
) of the CMS Silicon Strip Tracker has a peaking time
![]() and is clocked with the bunch crossing period of
and is clocked with the bunch crossing period of ![]() . It includes an analog pipeline
and an analog pulse shape processor (APSP), which performs the deconvolution using
switched capacitors.
. It includes an analog pipeline
and an analog pulse shape processor (APSP), which performs the deconvolution using
switched capacitors.
The deconvolution method has been included in the silicon detector
simulation discussed in section ![[*]](crossref.gif) , p.
, p. ![[*]](crossref.gif) .
Fig.
.
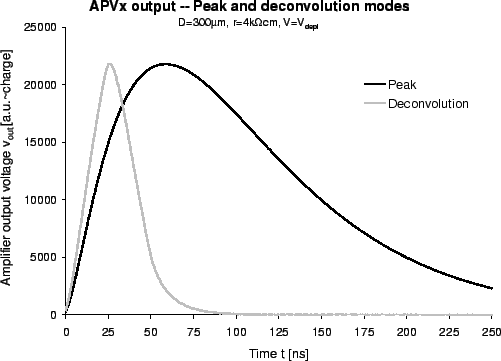
Fig. ![[*]](crossref.gif) shows the APV shaper output (``peak mode'') and the processed signal
(``deconvolution mode''). Although the real output consists of sampled values in steps of the
bunch crossing time, continuous waveforms have been calculated for easier
comparison.
shows the APV shaper output (``peak mode'') and the processed signal
(``deconvolution mode''). Although the real output consists of sampled values in steps of the
bunch crossing time, continuous waveforms have been calculated for easier
comparison.
 |
In fact, the deconvoluted output, when properly timed with respect to the
sampling points, is approximately zero except for one sample.
Two particles, producing a signals in consecutive bunch crossings, cannot be recognized
in the shaper output, but easily after deconvolution. Such a clear separation could not be
obtained by simply shaping with a shorter peaking time of
![]() , because the long tail
would result in a few non-zero samples after the peak. Thus, the deconvolution method
is a powerful tool for unambiguous bunch crossing separation.
This advantage has to be paid off by an increased noise figure, as discussed in
the following section.
, because the long tail
would result in a few non-zero samples after the peak. Thus, the deconvolution method
is a powerful tool for unambiguous bunch crossing separation.
This advantage has to be paid off by an increased noise figure, as discussed in
the following section.