![[*]](crossref.gif) , p.
, p. ![[*]](crossref.gif) ). Similar to the APV25, the lasers were also positioned
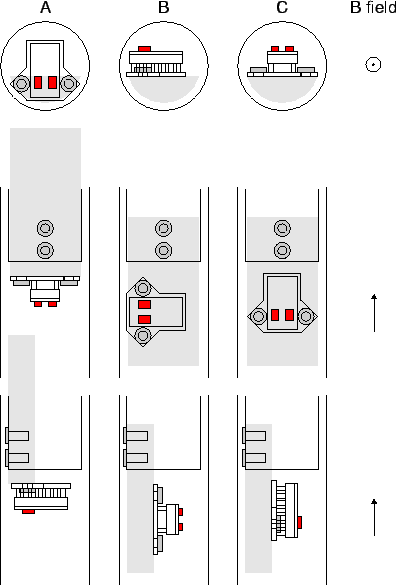
in three orientations (A, B and C) as shown in fig.
). Similar to the APV25, the lasers were also positioned
in three orientations (A, B and C) as shown in fig. ![[*]](crossref.gif) .
.
This test was performed in collaboration with the CMS Tracker Optical Links group [72].
Two different types of semiconductor lasers were tested in the same magnetic field
as the APV25S1 (see section ![[*]](crossref.gif) , p.
, p. ![[*]](crossref.gif) ). Similar to the APV25, the lasers were also positioned
in three orientations (A, B and C) as shown in fig.
). Similar to the APV25, the lasers were also positioned
in three orientations (A, B and C) as shown in fig. ![[*]](crossref.gif) .
.
 |
In this test, the lasers were driven by a programmable current source and optically connected to the analog optical link receiver hybrid. The voltage drop at the laser diode and the output of the analog receiver (level, linearity and noise) were measured as a function of the input current within the parameter space defined by laser type, orientation and magnetic field. Additionally, the optical output power and spectrum were analyzed.
 |
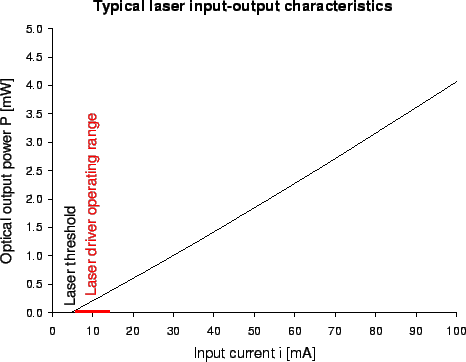
![[*]](crossref.gif) shows the optical output power of a typical semiconductor
laser depending on the input current.
Above a certain threshold, the light output power linearly increases with the input current.
In this plot, the input current varies between zero and
shows the optical output power of a typical semiconductor
laser depending on the input current.
Above a certain threshold, the light output power linearly increases with the input current.
In this plot, the input current varies between zero and A typical output spectrum of an edge-emitting semiconductor laser with a nominal wavelength of
![[*]](crossref.gif) .
The lasing semiconductor is a narrow-band emitter of approximately Gaussian spectral shape
enclosed in an optical resonator, consisting of two facing mirrors. One of the mirrors is
semi-transparent to extract the light into the optical fiber.
The optical resonator only leads to amplification when an integer multiple of half the wavelength
fits in between the mirrors; other wavelengths are extinguished by destructive interference.
This leads to the forked structure in the spectrum. The resonator condition for constructive
interference is given by
.
The lasing semiconductor is a narrow-band emitter of approximately Gaussian spectral shape
enclosed in an optical resonator, consisting of two facing mirrors. One of the mirrors is
semi-transparent to extract the light into the optical fiber.
The optical resonator only leads to amplification when an integer multiple of half the wavelength
fits in between the mirrors; other wavelengths are extinguished by destructive interference.
This leads to the forked structure in the spectrum. The resonator condition for constructive
interference is given by
| (5.4) |
In the sample spectrum shown in fig. ![[*]](crossref.gif) , the two highest adjacent peaks are
found at
, the two highest adjacent peaks are
found at
![]() and
and
![]() . Eq.
. Eq. ![[*]](crossref.gif) returns
a length of
returns
a length of ![]() for the optical resonator. The actual length is unknown, but
all lasers tested for CMS have a resonator length about one millimeter.
for the optical resonator. The actual length is unknown, but
all lasers tested for CMS have a resonator length about one millimeter.
It is obvious that the position of the spectrum peaks strongly depend on the actual length of the
resonator. In fact, the method of interferometric length measurement employs this principle.
When the laser is powered by a current flow, it slightly heats up compared to the zero current state.
This causes the resonator to expand, resulting in a peak shift towards higher wavelengths.
With an input current of ![]() (corresponding to an electrical input power of approximately
(corresponding to an electrical input power of approximately ![]() ), peak shifts in the order of
), peak shifts in the order of
![]() were observed, indicating a resonator expansion of approximately
were observed, indicating a resonator expansion of approximately ![]() .
.
The only effect observed in a precision scan of the magnetic field was a small shift in the
laser threshold and slope. As shown in fig. ![[*]](crossref.gif) , the laser threshold
approximately depends on the square of the magnetic flux density, decreasing by about
, the laser threshold
approximately depends on the square of the magnetic flux density, decreasing by about ![]() at
at ![]() .
The effect on the slope is even smaller. A relative change of less than
.
The effect on the slope is even smaller. A relative change of less than ![]() has been observed
at the maximum magnetic field of
has been observed
at the maximum magnetic field of ![]() .
.
Thus, the influence of the magnetic field is very small. In fact, temperature effects largely dominate the performance of the laser, such that the presence of a magnetic field is irrelevant regarding the application in CMS. Not only the wavelength is affected by temperature, but also the input-output characteristics of the laser.