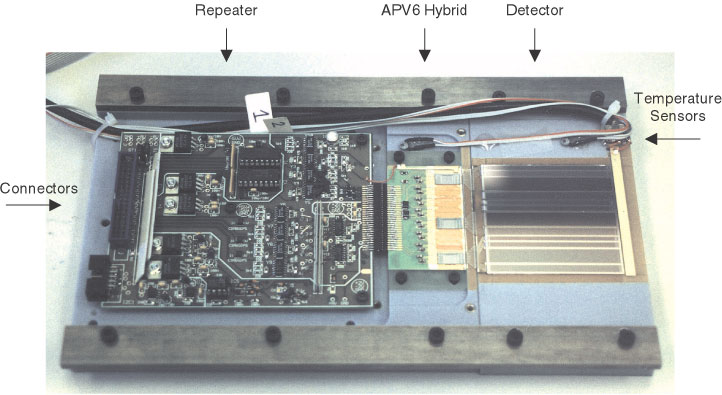
The very first silicon detector module with APV6 readout was constructed in early 1998 at HEPHY. Three chips were amplifying the signals of a single silicon detector with 384 strips. The assembled detector module was tested both in laboratory with a source and in a particle beam at CERN. Detailed information about the setup can be obtained at [62].
Fig. ![[*]](crossref.gif) shows this silicon detector module on a support together with an early
repeater and temperature probes.
shows this silicon detector module on a support together with an early
repeater and temperature probes.
.
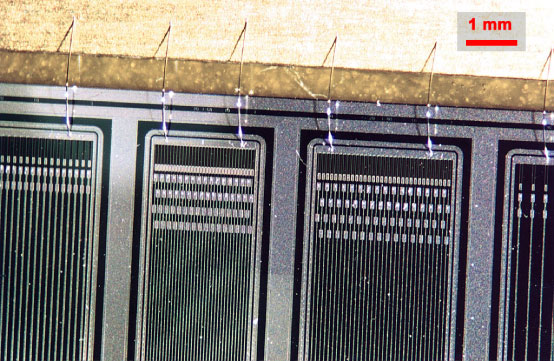
Each zone was surrounded by a guard ring structure, as shown in the detailed view of
fig. .
 |
The beam data were already analyzed and published [62] shortly after the beam test. However, to get consistent results with later beam tests, the raw data were completely re-analyzed with the same software and parameters that were used for the other tests. Thus, the results presented here are slightly different from what was published earlier, but allow direct comparison to the other APV measurements.
The beam test was performed at the X5 beamline of the SPS accelerator at CERN. It delivers
highly relativistic
pions and muons with a momentum of
![]() , which have
a mean ionization of
, which have
a mean ionization of ![]() above the MIP level. This excess is approximately compensated
by a small jitter of the trigger relative to the particle crossing.
The module was placed in a moderately cooled environment at an ambient temperature of
above the MIP level. This excess is approximately compensated
by a small jitter of the trigger relative to the particle crossing.
The module was placed in a moderately cooled environment at an ambient temperature of
![]() , where all measurements were performed in deconvolution mode.
, where all measurements were performed in deconvolution mode.
According to eq. , p. , the
strip capacitance is a linear function of ![]() . Moreover, the amplifier noise, as shown in
eq. , p. , linearly depends on the capacitance and thus on
. Moreover, the amplifier noise, as shown in
eq. , p. , linearly depends on the capacitance and thus on ![]() . The SNR implicitly
takes over the inverse functional dependence as shown in fig. .
The prediction has been obtained from capacitance values calculated by eq. ,
an APV6 amplifier noise of
. The SNR implicitly
takes over the inverse functional dependence as shown in fig. .
The prediction has been obtained from capacitance values calculated by eq. ,
an APV6 amplifier noise of
![]() and a MIP charge of
and a MIP charge of ![]() .
.
These results were measured at a bias voltage of ![]() . Other runs were performed at
. Other runs were performed at
![]() , resulting in SNR values between
, resulting in SNR values between ![]() and
and ![]() , depending on the
zone. The SNR decrease of approximately
, depending on the
zone. The SNR decrease of approximately ![]() indicates that the multiregion detector
was not fully depleted at
indicates that the multiregion detector
was not fully depleted at ![]() .
.
An angle scan between ![]() and
and ![]() was performed on two different zones.
Due to the longer path of particles in the detector, the deposited energy and thus the signal increases.
In relation to the collected charge
was performed on two different zones.
Due to the longer path of particles in the detector, the deposited energy and thus the signal increases.
In relation to the collected charge ![]() at perpendicular incidence (
at perpendicular incidence (![]() ),
the charge
),
the charge ![]() at a tilt angle
at a tilt angle ![]() is given by
is given by
| (5.1) |
Fig. shows the dependence of the cluster width on the tilt angle for
two different zones with the fit function (eq. ) applied.
Due to geometrical reasons, the projection of an inclined particle track covers a larger
number of strips if their pitch is smaller, explaining the different cluster width curves.
After the beam test, source tests were performed with the same setup, yielding compatible results.