

Next: APV25 Irradiation (December 2000)
Up: APV6/APV25 Beam Tests (May/December
Previous: High Intensity
Contents
Multi-Peak Mode
As pointed out in section ![[*]](crossref.gif) , p.
, p. ![[*]](crossref.gif) , the APV Sequencer is able to generate a programmable
trigger pattern which is issued either by software or hardware trigger. Together with the
multi-peak mode of the APV25, this feature can be used to effectively obtain subsequent
samples of the shaping curve from a particle signal.
, the APV Sequencer is able to generate a programmable
trigger pattern which is issued either by software or hardware trigger. Together with the
multi-peak mode of the APV25, this feature can be used to effectively obtain subsequent
samples of the shaping curve from a particle signal.
Figure:
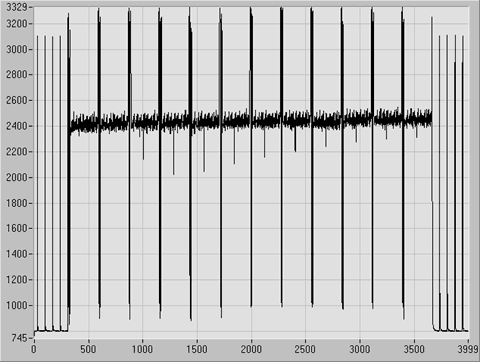
Screenshot of the raw APV25 output with consecutive samples obtained
with a trigger sequence in multi-peak mode, representing a single particle hit.
 |
Fig. ![[*]](crossref.gif) shows an example of the APV25 output in this mode.
Four triggers separated by
shows an example of the APV25 output in this mode.
Four triggers separated by  are sent to the APV25, which returns three consecutive
samples after each trigger, resulting in a total of twelve sequential samples,
revealing the (negative) pulse shape.
The average waveform obtained from this measurement matches with the peak mode
pulse shape scanned by internal calibration.
A pulse shape fit has been applied to every multi-event, returning the peaking time position.
With the normal scintillator trigger, the distribution of these peaking times
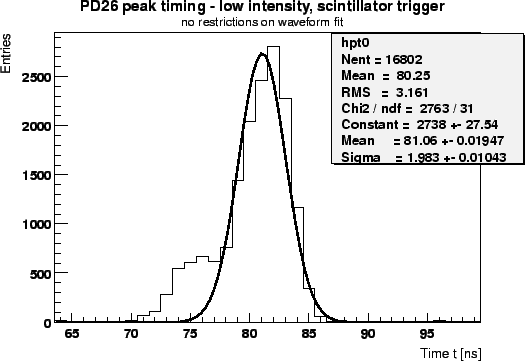
are an indicator for the quality of timing and synchronization. As shown in fig. ![[*]](crossref.gif) ,
an RMS peaking time spread of
,
an RMS peaking time spread of  was obtained, including beam fluctuations, the timing jitter
and the fit error.
Figure:
APV25 peaking time distribution with scintillator trigger at
low intensity.
 |
Figure:
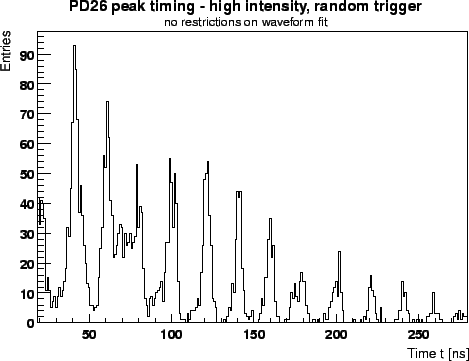
APV25 peaking time distribution with random trigger at high
intensity, revealing the  PSI beam period.
 |
The same measurement was repeated at high intensity with random triggering. With the APV25
still clocked at the nominal  , the PSI beam structure of
  (corresponding to
  ) is visualized (fig.
 ![[*]](crossref.gif) ).
The pulse shape fit does not always converge. With a later peak, less signal samples
are contained within the measurement window, making the fit procedure more difficult.
Fits which did not converge were not included in this plot, leading to fewer entries with increasing
peaking times, although the peaking times are evenly distributed over the full scale.
).
The pulse shape fit does not always converge. With a later peak, less signal samples
are contained within the measurement window, making the fit procedure more difficult.
Fits which did not converge were not included in this plot, leading to fewer entries with increasing
peaking times, although the peaking times are evenly distributed over the full scale.


Next: APV25 Irradiation (December 2000)
Up: APV6/APV25 Beam Tests (May/December
Previous: High Intensity
Contents
Markus Friedl
2001-07-14
![[*]](crossref.gif) , p.
, p. ![[*]](crossref.gif) , the APV Sequencer is able to generate a programmable
trigger pattern which is issued either by software or hardware trigger. Together with the
multi-peak mode of the APV25, this feature can be used to effectively obtain subsequent
samples of the shaping curve from a particle signal.
, the APV Sequencer is able to generate a programmable
trigger pattern which is issued either by software or hardware trigger. Together with the
multi-peak mode of the APV25, this feature can be used to effectively obtain subsequent
samples of the shaping curve from a particle signal.


